Contents
- 1 Introduction
- 2 Installing the perftracker server
- 3 Installing the perftracker client
- 4 Writing the performance tests
- 5 Combining the individual tests to a performance test suite
- 6 Launching your test suite by cron
- 7 Manual performance comparison on several application builds
- 8 Automated performance regression tracking
Introduction
If you develop a web application or a backend server or maybe even a complicated distributed system you might be interested in regular performance testing of the builds available in your CI process to prevent performance degradations in the releases or track performance improvements. In this workflow example we will explain all the steps needed to do it. The web application testing scenario will be taken as example. However, despite the fact, the performance tests will be different for different systems, the overall performance CI workflow will be very similar in all the cases.
Let’s assume you have regular (daily) build of your web project deployed at www.example.com and want to be sure that performance of your application pages is still fine and does not degrade after a bunch of daily commits.
Let’s imagine you are interested mostly in testing the following pages:
- www.example.com/
- www.example.com/news
- www.example.com/blog
- www.example.com/about
and want to test latency and throughput once a day
Installing the perftracker server
In this example, we will assume you have already python3 installed and show how to install the latest perftracker version from git and run it on top of local sqlite database
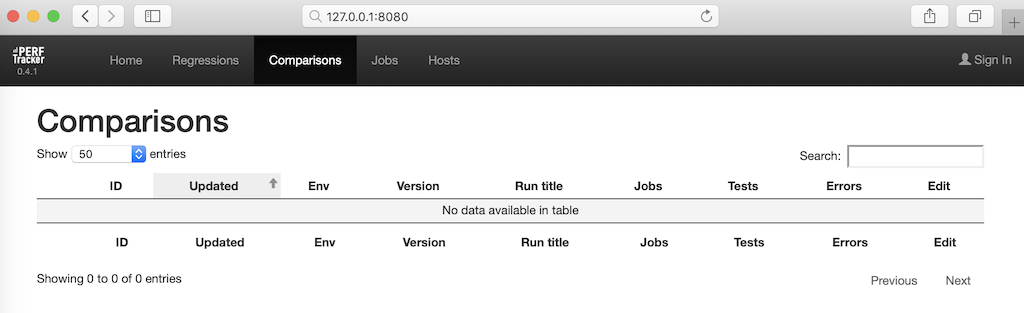
Open the http://127.0.0.1:8080 in your browser and you should be able to see something like this:
Please read the perftracker README.md for more advanced installation and deployment options.
Installing the perftracker client
The perftracker client libraries must be installed on every client machine where you are going to run performance tests:
Writing the performance tests
Now it’s time to write your performance tests or take an existing one and wrap it around. To make this example simple we’ll take a standard third-party ab (apache benchmark) performance test which is shipped as a part of the standard httpd-tools package available on any Linux distributive.
First, lets run it manually and ask it to do 100 requests (-n 100) to http://www.example.com with concurrency equal to 1 (-c 1) and with keep-alive (-k) enabled:
TODO
Combining the individual tests to a performance test suite
TODO
Launching your test suite by cron
TODO
Manual performance comparison on several application builds
TODO
Automated performance regression tracking
TODO